
Our guide to measuring and tracking labour productivity
Key Takeaways
- Labour productivity is output divided by labour input, the amount of work your crews complete for every hour they are paid. Measuring it turns a vague sense that a job is running hot into a number you can act on before the margin is gone.
- The core productivity metric is the quantity of work completed against the labour hours used – benchmarked against your baseline by area, sub-area, cost code or element. That single metric tells you whether a job is on or off track while the project is still in progress.
- Accurate measurement depends on clean inputs. Without reliable labour timesheet hours, established baselines and quantities captured as the work happens, any productivity figure is a guess dressed up as data.
- A productivity rate on its own tells you nothing. Eight units an hour is neither good nor bad until you hold it against the baseline the job was priced to hit, the rate you tendered on, your historical performance or an industry benchmark, and that comparison is what tells you whether the job is protecting your margin or eating into it.
Labour productivity is a measure of how much work your crews complete for each hour they are paid, usually expressed as output per labour hour. You measure it by dividing the output produced by the labour input (the hours worked to get there) then comparing that rate against the baseline you estimated for the job. Get the inputs right and that single number tells you where a project is winning and where it is quietly leaking money.
For most subcontractors, labour is the largest controllable cost on a job and the one that moves fastest. Material costs stay close to what you ordered, but labour hours can run well past what you estimated, and that gap comes straight out of your margin.
Measuring productivity as you go is how you catch the drift while you can still do something about it. This guide is written for subcontractors and construction businesses that want to measure labour productivity on their own jobs, and it walks through what labour productivity is, how to calculate it and the metrics and inputs that make the measurement trustworthy.
What is labour productivity?
Labour productivity is the ratio of output to labour input. In construction that means a physical quantity of completed work divided by the hours worked to complete it. The unit changes with the trade, for example, m3 of concrete placed per labour hour, m2 of formwork stripped per day, tonnes of steel fixed per shift, but the mechanism stays the same: quantity over hours.
That number on its own gives you little. A productivity rate is only valuable when it’s measured against the baseline the job was priced on, and the baseline itself varies by trade, area, sub-area, cost code and element because the work underneath it varies too.
A formwork crew and a steel fixing crew are never going to post the same number. One measures progress as a percentage of a pour finished, the other in tonnes off a delivery docket – and a tonnes-per-hour productivity rate means nothing next to a percentage-per-hour rate.
Even within a single trade, area, sub-area, cost code and elements will have varying productivity rates. A ground floor with simple specs will out-produce a level with a lift core and a dozen penetrations. Similarly, a straightforward slab pour will out-produce the next pour over if that one carries stop ends and hobs. Productivity at an element level also moves at different speeds: ply-jointing at a soffit is slow, careful work, while erecting frames is comparatively quicker.
These variances and nuances are exactly why baselines exist, and need to be built by area, sub-area cost code and element. Each of these components need to be judged against its own estimate, not another.
It helps to separate labour productivity from two things it is often confused with. It is not the same as production, which is simply how much you built, with no reference to effort. And it is not the same as cost either. Cost and productivity are closely related, but productivity is a live rate, measured against the baseline it was priced on, that protects your labour margin.
Why measuring labour productivity matters
On a commercial or civil job, labour is where the margin is won or lost. Most subcontract work is priced as a lump sum or a fixed rate, so once the contract is signed, the price for the job doesn’t move even if the hours to build it do.
Material costs stay close to what you ordered but labour hours can run well past what you estimated, and that gap comes straight out of your margin. Hold your labour rate through the job and the margin you tendered is the margin you keep. Let it slip and the profit walks out the gate an hour at a time.
The construction industry gives you little room to absorb that slip. Figures from the Australian Bureau of Statistics and the Productivity Commission show construction's labour productivity grew only 17% over the past thirty years, against 64% across other market-sector industries over the same period. On a fixed price, that gap with the wider market sector is not an economic footnote. It is the margin you wear directly while your competitors on the same tender wear it too.
The real cost is local and it does not announce itself. There is no invoice for a crew that took 400 hours to do 300 hours of work. The overrun hides inside a labour budget that looked healthy at tender and blew out by handover, and it lands straight on your labour costs. It also compounds, because the rates you cannot measure on this job are the rates you carry into your next tender, so the business that does not know its real productivity either prices too high and loses the work or prices too low and loses the margin.
Measuring productivity through the job turns that hidden leak into an early warning, and into more output from the same hours worked rather than a surprise at handover. The upside is commercial, not theoretical. The Construction Industry Institute has estimated that better management practices, technology and data could deliver productivity gains of 30 to 40%, and on a fixed-price job that improvement drops straight to profit and helps put the sector's productivity growth back on track.
How to measure labour productivity: the core formula
The base calculation is deliberately simple:
Labour productivity = quantity of work completed ÷ labour hours worked (measured against a baseline)
Place 60 cubic metres of concrete in 40 hours and your productivity is 1.5 cubic metres per hour. That figure alone is worth little – it’s only a true productivity rate once you know what the job was priced to achieve. If the baseline for that pour was 1.2 cubic metres per hour, the crew is ahead. If the baseline was 2 cubic metres per hour, then productivity is behind. In both these scenarios, the raw number looks identical.
Some estimators prefer the inverse formula for productivity, expressed as hours per unit – in this case 0.67 hours per cubic metre. Both formulas and outputs are correct, provided the baselines are measured against the same formula, but both are equally meaningless without the baseline they’re being measured against.
Which labour productivity metrics should you track?
Once you've calculated a productivity rate, the number on its own won't tell you much. The value is in what sits behind it. Here are the key themes and insights to look for:
1. Variance against baseline – not the rate in isolation
The number one thing to check – how your productivity rate compares to what was estimated for that specific area/sub-area/cost code/element. A rate is only meaningful relative to its own baseline, and should never be compared across different types of work. Identify if it’s trending above or below target.
2. Decide whether the gap is showing up early enough to act on it
This is the leading vs lagging indicator distinction. A daily productivity rate is a leading indicator – it tells you today whether a job's on budget, while there's still time to fix it. The alternative, such as waiting for the P&L (typically the case in many cost management solutions), is a lagging indicator, which only tells you after the labour's already been spent and it's too late to intervene. So the thing to look for isn't just "Is this red?" but "Am I seeing this red early, not weeks later?”.
3. Drill-down into granular patterns at the cost-code or element level
Taking the example of concrete patching, consistently running over budget at a cost code level can reveal a quality issue, not just a productivity issue. For example, poor ply jointing at the soffit causing lines that need repairing is more likely a quality issue rather than a productivity issue. An underperforming cost code is worth taking the time to ask why.
4. Whether a dip on one area/pour is spreading to the next
Without daily productivity tracking, a problem on one pour or level isn't caught before it repeats on the next. So part of what to look for is a rate dropping on a sub-area before the same crew moves on to the next one. Daily visibility is what makes problems catchable.
5. Trends across projects, not just within one
Productivity data that is captured consistently over time or across jobs allow you to compare trends and surface insights. A singular view into one project’s productivity is useful, but historical data across different projects strengthens your overall productivity and makes better estimations possible.
What you need before the numbers mean anything
A productivity figure is only as good as the three inputs behind it, and this is where most manual systems fall down.
The first is accurate labour hours worked, captured at the task level rather than as a lump sum at the end of the week. Paper dockets and memory-based timesheets round hours to the nearest half day and rarely tie hours to the right activity, which quietly corrupts every rate you calculate from them. Moving hour capture onto the phones your crews already carry, with digital timesheets that record time against the job and cost code as it happens, fixes the problem at the source.
The second is quantities, the output side of the ratio. Someone has to record how much work was actually completed, ideally as part of the daily site record rather than a separate chase at month-end.
The third is the baseline, the estimated hours and quantities the job was priced on, broken down to the same areas, sub-areas, cost codes and elements you are measuring against. Without an agreed baseline you can calculate a rate but you cannot tell whether it is good or bad, and productivity measured against nothing is just a number.
Common mistakes when measuring labour productivity
Even businesses that measure often measure in a way that misleads them. The most common error is productivity measured too late, waiting for month-end payroll or cost reports, by which point the productivity story is history and the loss is banked. The second is dirty hours data, rates built on rounded or misallocated time that look precise but describe nothing real.
Three more show up again and again. Measuring the whole job instead of individual cost codes, which lets a strong activity mask a failing one. Comparing crews without normalising for the work or the conditions, which turns a measurement tool into a morale problem. And ignoring rework and idle time, counting the hours worked but not the fact that some of them produced nothing, so the number flatters a job that is actually struggling.
How a construction operations platform makes productivity measurable
Every problem above traces back to the same root, the data needed to measure productivity is scattered across dockets, spreadsheets, whiteboards and heads, and it arrives too late to act on. A construction operations platform pulls those inputs into one place so the measurement happens by itself, and productivity growth stops being an accident you notice after the fact.
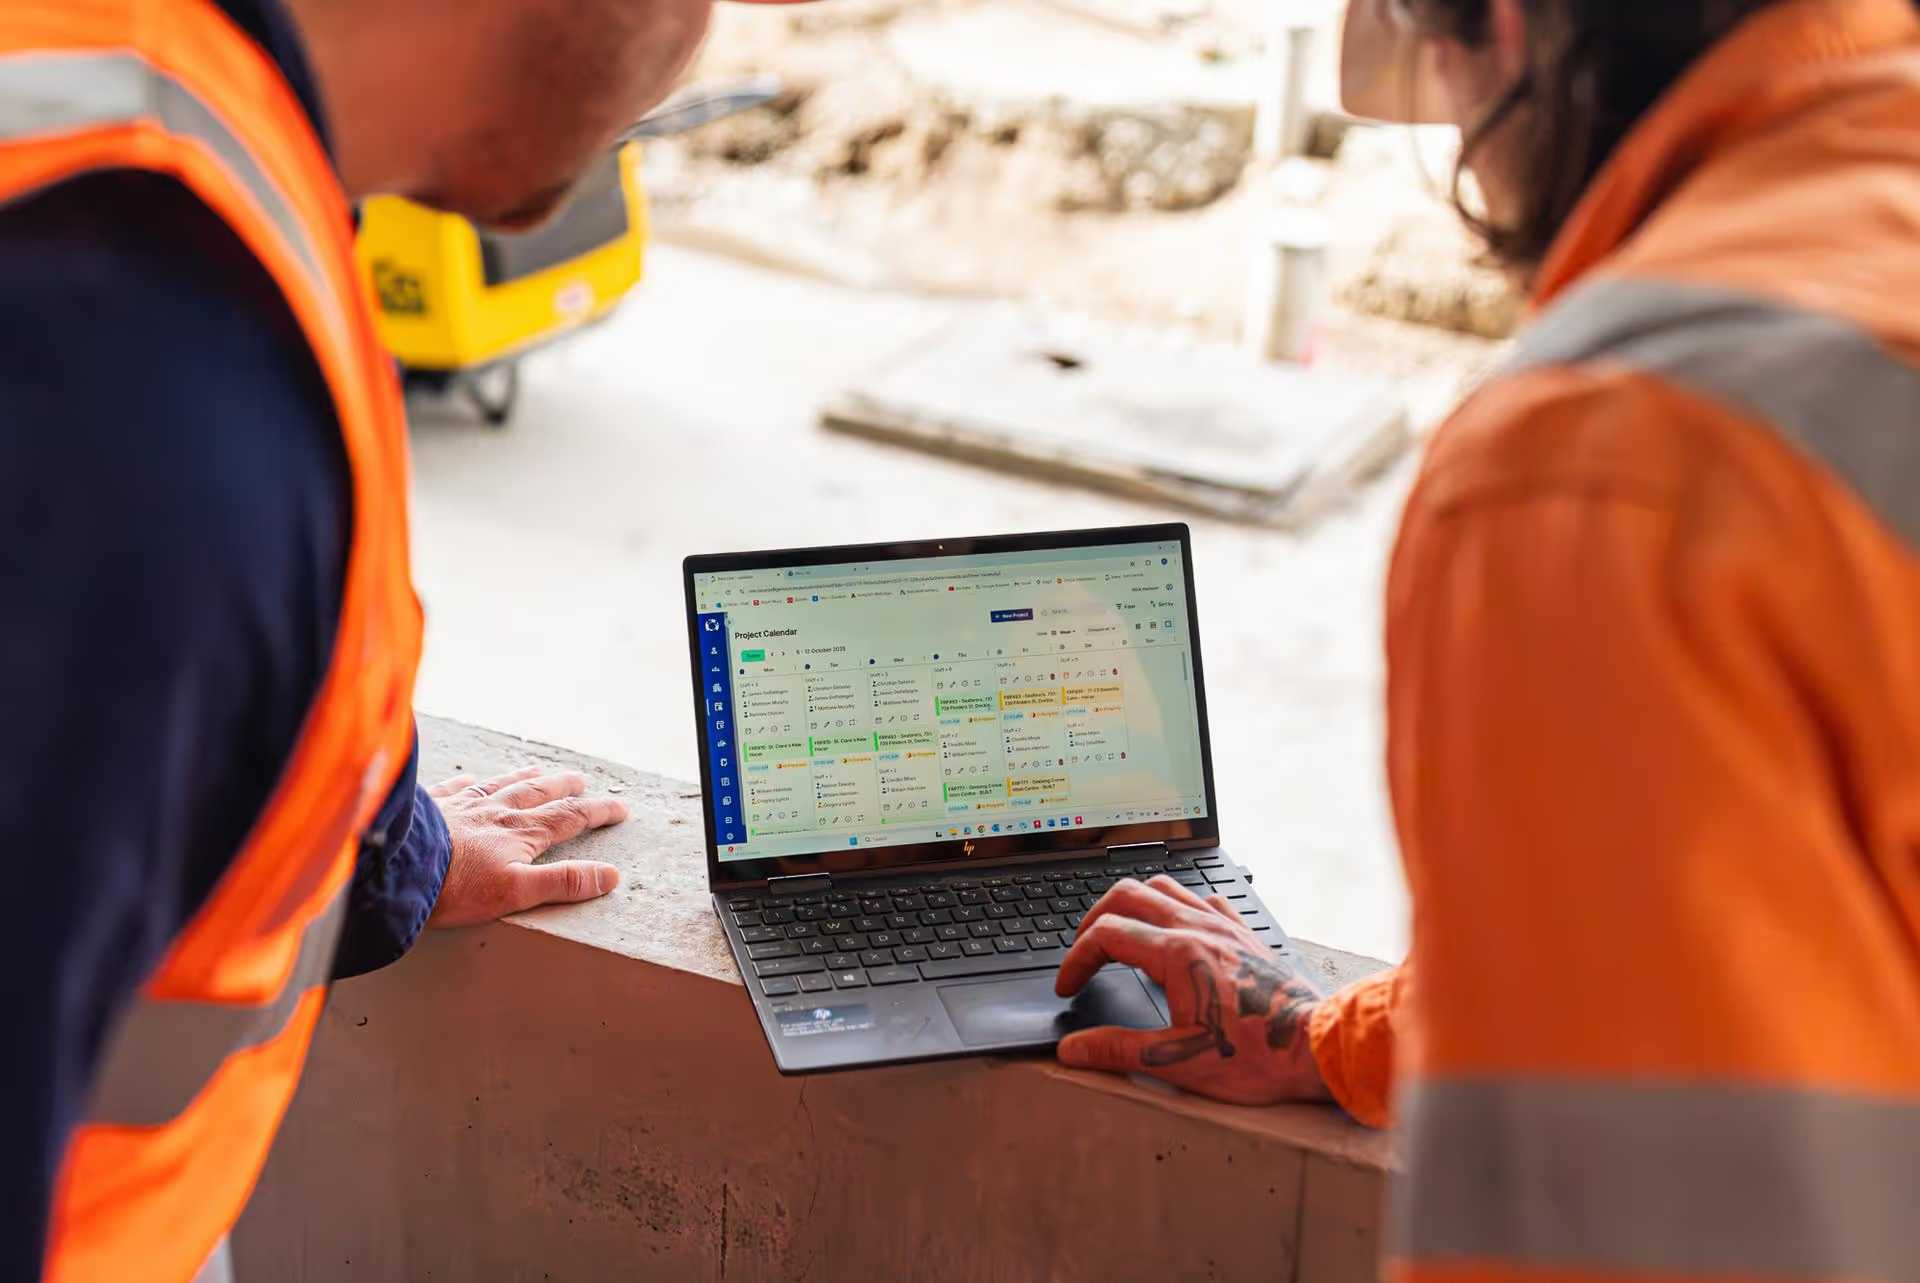
Neo Intelligence is a construction operations platform built for Australian subcontractors, and it closes the loop between the hours worked that your crews log and the work they complete. Because hour capture, scheduling and site records live in the same system, you can keep track of work productivity against a baseline in real time, drilling into cost codes, areas and supervisors to see exactly where labour costs are running hot. Scheduling the right people to the right task plays into the same number, so connecting operator tickets and competencies to the roster through crew management keeps qualified crews matched to the work instead of standing idle.
The difference is timing. PCF Managing Director Steve Sarris put it plainly, "For years, we were finding out a job had run over on labour at the end. Now with Neo, we can red flag issues before they occur." That shift, from finding out at month-end to seeing it day to day, is the whole point of measuring productivity in the first place, and it is where real productivity growth on the next job starts.
Want to see your own labour data turned into a live productivity view? Book a demo and we will walk you through it.
Labour productivity FAQs
What is a realistic labour productivity benchmark in construction?
There is no universal benchmark, because productivity depends on the trade, the task and the conditions. A rate that holds on an open civil site will not hold in a tight CBD basement. The most reliable benchmark is your own historical data for the same activity in similar conditions, which is one of the strongest reasons to capture productivity on every job even when the current one looks healthy.
What is the difference between labour productivity and labour efficiency?
Labour productivity measures output per hour worked – how much was actually produced for the labour that went into it. Efficiency is a related but different question – how did that output compare to what was planned or estimated? The two work together. Productivity tells you what happened, and efficiency tells you whether it was good or bad relative to the plan.
In Neo, Productivity Tracking provides insights into both. Each productivity rate is shown against its baseline, so you can immediately see whether actual output is tracking on, above or below what was estimated for that specific area, cost code or element.
Does working longer hours improve labour productivity?
Sustained overtime lifts total output in the short run but lowers output per hour, because fatigue, rework and lost focus erode the value of the extra time. Once crews run at 50 or 60 hours for weeks on end, productivity per hour drops, so if hours climb while your unit rate falls, the extra shifts are likely costing more than they return. There's a separate hit too, one that sits outside productivity tracking. Penalty rates mean overtime comes straight off your margin, and on a fixed-price job that lands on your bottom line, not the client's.
How do you account for weather and disruptions when measuring productivity?
Separate the disruption from the crew. The measured mile method compares productivity during an undisrupted stretch of the same work against a disrupted stretch, so weather, design changes or access delays surface as a quantified loss rather than getting blamed on the fieldworkers. Recording site conditions and delays against the day's hours as they occur is what makes that comparison possible later, and it doubles as the evidence you need if a productivity loss becomes a variation or a claim.
Does crew size affect labour productivity?
Yes, and it works both ways. Put too many fieldworkers on a task and you burn more labour hours than the quantity needs, so output per hour drops – each extra worker adds less than the last. Put too few on and the crew can still be productive hour for hour, but you fall behind the program and those delays blow out your margin on a fixed-price job. Short staffing can also drag productivity where people aren't allocated properly across areas, sub-areas, cost codes and elements, and each delay cascades. The fix is to size crews to the workfront available and watch output per hour as you flex numbers, so you can spot where another pair of hands stops paying for itself.

Frequently Asked Questions
Construction management software for subcontractors is software that helps subcontracting businesses manage crews, schedules, labour hours, compliance requirements and site documentation across multiple projects. It is designed for labour-intensive, site-based work and supports payroll accuracy, EBA and award compliance and the records needed to verify work performed.
Neo is subcontractor operations software built to solve common problems around managing crews, labour hours, compliance requirements and site records across multiple projects. Disconnected schedules, manual timesheets, payroll errors and missing site records lead to rework, disputes and margin leakage. Neo replaces fragmented processes with a single platform that keeps labour data, site activity and compliance aligned across every job.
Neo is subcontractor software used by construction businesses managing crews across multiple sites and projects. This includes a wide range of labour‑intensive, field‑based trades, such as concrete placement, concrete pumping, formwork, steel fixing, civil construction and labour hire, that rely on accurate crew scheduling, labour tracking, site documentation and EBA or award compliance to run their business efficiently
Neo is built for subcontractors of different sizes that manage crews across multiple projects. The subcontractor operations software supports both growing teams and larger subcontracting businesses, scaling as workforce size, project count and operational complexity increase.
Spreadsheets and whiteboards rely on manual updates and are often out of date, leading to missed changes, double booking and fragmented records. Neo is subcontractor software that provides real‑time scheduling, automated crew notifications, linked timesheets and site records in a single platform, ensuring crews in the field and teams in the office work from the same up‑to‑date information.
Neo subcontractor software pricing is structured around packages that scale with your business. Costs depend on factors like workforce size and operational needs, ensuring subcontractors only pay for what they use. A demo is the best way to understand which package fits your business and expected ROI.
Other Blogs

Our guide to construction timesheets for subcontractors

The hidden cost of paper timesheets on site
How to build a labour estimate you can actually track against
Ready to see an easier way to run your subcontracting business?
Get the clarity, accuracy and confidence you need to keep jobs and crews moving.